
Category: Blogs

Why Lean Six Sigma Matters More Than Ever in IT & ITES -PART-2

How Lean Six Sigma Speeds Up Delivery in IT & ITES Speed is not about working harder. It is about removing waiting, rework, and confusion. ⚡ Value Stream Mapping (VSM) VSM visualizes the end-to-end IT workflow: Ticket logged Assigned Diagnosed Approved Fixed Closed Teams often discover: Multiple approval layers Idle waiting time Duplicate checks Unnecessary escalations ⚡ Elimination of Waiting Waste Lean Six Sigma targets: Queue time Dependency delays Approval bottlenecks ⚡ Cycle Time Reduction By streamlining approvals and clarifying ownership, teams reduce lead time dramatically. Example: A release cycle drops from 4 weeks to 2 weeks after eliminating redundant approvals and automating test scripts. Lean Six Sigma Tools Tailored for IT & ITES Lean Six Sigma works because it translates business pain into measurable improvement actions. Industry-Specific Use Cases 💻 Software Development Reduce post-release defects Improve sprint predictability Lower rework rate 📞 ITES / BPO / KPO Improve First Call Resolution Reduce Average Handling Time Lower escalations 🛠 IT Infrastructure Reduce downtime Improve incident response time Strengthen preventive maintenance 📊 Data Services Improve data accuracy Reduce rework Improve delivery SLAs Benefits of Lean Six Sigma in IT & ITES Organizations implementing Lean Six Sigma correctly achieve: ✅30–60% reduction in defects ✅Faster release cycles ✅Lower rework cost ✅Improved SLA adherence ✅Higher customer satisfaction ✅Less employee burnout ✅Stronger governance The biggest benefit? Predictability. Leaders stop managing chaos and start managing performance. Common Mistakes to Avoid in IT Lean Six Sigma Deployments ❌ Treating LSS as documentation exercise ❌ Applying DMAIC to problems with known solutions ❌ Not involving frontline teams ❌ Ignoring change management ❌ Focusing only on cost, not customer experience Lean Six Sigma is successful when it becomes a working habit, not a one-time project. How ICEQBS Enables Lean Six Sigma Success in IT & ITES ICEQBS follows a practitioner-first approach, not theory-heavy certification. We help IT and ITES professionals: Select the right projects Apply tools to live business problems Deliver measurable business impact Align projects to leadership priorities Build improvement capability, not just credentials Our training ensures participants don’t just “learn Six Sigma” — they use Six Sigma to solve real digital problems. Final Thoughts: From Digital Chaos to Process Excellence Lean Six Sigma is not about controlling people. It is about stabilizing processes in an unpredictable digital world. When IT and ITES teams embed Lean Six Sigma: Firefighting reduces Delivery becomes predictable Customers trust the system Leaders trust the data Teams gain confidence In a world where digital failure is public and instant, Lean Six Sigma gives IT teams a repeatable system for excellence. Call to Action Want to implement Lean Six Sigma in your IT or ITES operations with real business results? 👉 Explore ICEQBS Lean Six Sigma programs 👉 Build high-impact projects 👉 Move from firefighting to performance leadership ICEQBS – Where Process Excellence Meets Digital Execution  

Explore More

Why Lean Six Sigma Matters More Than Ever in IT & ITES -PART-1

In today’s hyper-digital world, customers don’t compare your IT service with your competitor’s IT service — they compare it with the best digital experience they’ve ever had. Whether it’s a banking transaction, a mobile app update, a helpdesk response, or a data processing service, expectations for speed, accuracy, and reliability are brutally high. Yet most IT and IT-enabled services (ITES) teams operate in constant firefighting mode: Bugs appear after release Tickets pile up in queues Customers escalate for delayed responses Rework eats into delivery capacity Teams feel overwhelmed This is where Lean Six Sigma (LSS) becomes a game changer. Originally born in manufacturing, Lean Six Sigma has evolved into a powerful methodology for service excellence and digital operations. When applied correctly, it helps IT and ITES teams: Reduce recurring errors Speed up delivery cycles Improve service consistency Lower operational costs Build customer trust Lean Six Sigma is not about bureaucracy or paperwork. It is about building reliable digital processes that scale without chaos. Why Lean Six Sigma is Perfectly Suited for IT & ITES IT and ITES deliver intangible services — code, tickets, transactions, reports, analytics, support. Unlike manufacturing, defects are invisible until the customer feels the pain. But the underlying problems are the same: Common IT & ITES Pain Points Coding defects and post-release bugs Repeated rework due to unclear requirements Delays in approvals and handoffs High ticket turnaround time (TAT) Inconsistent service quality Escalations and customer dissatisfaction Lean Six Sigma brings structure to chaos by combining: Lean→ Speed, waste removal, flow Six Sigma→ Accuracy, defect reduction, consistency Together, they transform IT delivery from reactive firefighting to predictable, high-quality execution. Common Process Challenges in IT & ITES (Root Causes, Not Symptoms) Most IT teams see symptoms. Lean Six Sigma helps uncover root causes: Without structured improvement, these problems repeat endlessly — only the pressure changes. How Lean Six Sigma Reduces Errors in IT & ITES Errors in IT can mean downtime, data loss, compliance risk, and customer churn. Lean Six Sigma attacks errors scientifically, not emotionally. 🔹 Root Cause Analysis (Fishbone, 5 Whys) Instead of fixing the same bug repeatedly, teams identify: This moves problem-solving from opinion-based to evidence-based. 🔹 Process Standardization Lean Six Sigma builds: This reduces variation between teams and individuals. 🔹 Defect Measurement What gets measured gets improved. 🔹 Statistical Monitoring Control charts and trend analysis help detect when error rates are increasing before customers start escalating. Example: A billing support team faces repeated customer complaints. LSS reveals inconsistent data entry rules as the root cause. Standardizing input formats and adding validation checks reduces complaint volume by 40%.

Explore More

Stop Treating Symptoms. Fix the Cause: Mastering Y = f(x) the Six Sigma Way

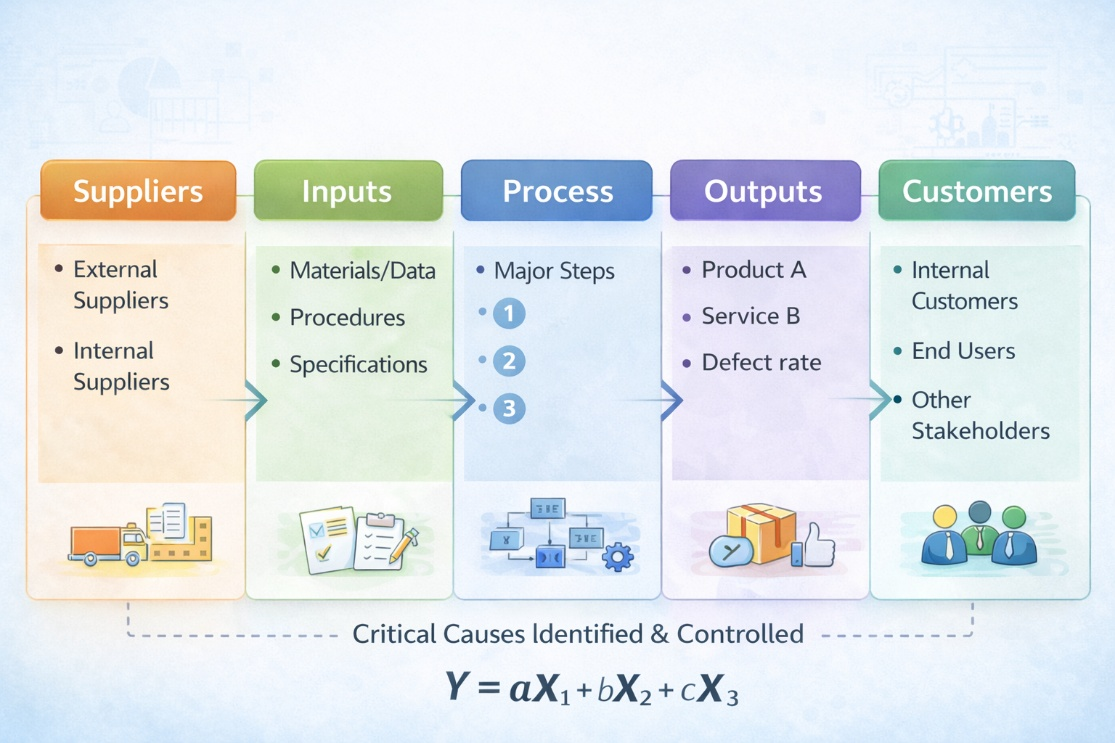
Introduction: Why Problems Keep Coming Back (Even After “Fixes”) Every organization wants better outcomes—fewer defects, faster delivery, happier customers, and predictable performance. Yet when results start slipping, most teams go into firefighting mode. More reviews. More pressure. More follow-ups. More “urgent” calls. For a short time, things improve. Then the same problems return. This cycle repeats because teams try to fix the result instead of fixing what caused the result. In Six Sigma, this misunderstanding is addressed by a simple but powerful idea: Y = f(x) Your results (Y) are a function of your causes (X). Once teams internalize this, problem-solving changes from reactive to systematic—and improvements begin to sustain. In any process, Y represents the outcome you want to improve: Defect rate Turnaround time Customer complaints SLA breaches Sales conversion Rework percentage These are called output variables or dependent variables—they depend on what happens inside the process. X represents the inputs and conditions that shape those outcomes: People (skills, training, fatigue, adherence to SOPs) Machines (settings, calibration, downtime) Methods (handoffs, approvals, rework loops) Materials/Data (quality, completeness) Measurement (definitions, inspection methods) Environment (workload, system uptime, distractions) These are independent variables. When X changes, Y changes. When X is unstable, Y becomes unstable. The core message: You can’t command results to improve. You can only improve the process conditions that create those results. Why Fixing Only the Output Never Works When defects rise, common reactions include: Pushing people harder Adding more checks Escalating to managers Extending working hours These actions may temporarily improve numbers. But they don’t remove the reason the problem occurred. Results are produced by the process. You can’t sustainably change results without changing the process conditions. This is the mindset shift Y = f(x) creates: From “who failed?” to “which variable changed?” This reduces blame, increases clarity, and builds ownership of the process. A Simple Real-Life Analogy (Why Treating the Wrong Cause Fails) Think of a headache. The headache is Y (the effect). Possible causes (X) include lack of sleep, dehydration, eye strain, stress, or infection. If dehydration is the cause and you take a stress tablet, the headache persists. Organizations do the same: Complaints rise → send warning emails Delays increase → push overtime Defects rise → scold operators If the real cause is poor machine calibration or unclear SOPs, none of these actions will fix the problem. Six Sigma teaches teams to validate causes with data before acting. Applying Y = f(x) to a Real Business Problem (Step-by-Step) Imagine a defect rate of 8% with a target of 4%. Step 1: Identify Possible Causes Teams brainstorm broadly: machine settings, training gaps, material quality, shift differences, workload spikes, unclear SOPs. This may yield 30–50 possible X’s. Step 2: Prioritize Likely Causes Using process maps and Cause & Effect Matrices, narrow down to 10–15 likely contributors. This focuses effort. Step 3: Validate the Critical X’s with Data Collect data for shortlisted X’s. Use Pareto, correlation, regression, or hypothesis testing to identify the 3–5 critical X’s that truly drive defects. This often yields a practical relationship like: Y = aX₁ + bX₂ + cX₃ Step 4: Improve Only What Matters Design solutions that directly target the critical X’s. Avoid spreading effort across low-impact factors. Step 5: Control the X’s to Sustain Results Set controls for critical X’s (standard work, control charts, audits). When X remains stable, Y remains stable. Tools That Help You Find and Control the Critical X’s Process Mapping:See where X’s enter the process Fishbone (Cause & Effect):Structure hypotheses Pareto Analysis:Focus on the vital few X’s Regression/Correlation:Quantify relationships DOE (Design of Experiments):Test cause-effect rigorously Control Charts:Keep critical X’s stable over time These tools turn Y = f(x) from theory into action. The Cultural Shift Y = f(x) Creates Before Y = f(x), teams ask: Why are people not performing? Why are targets not met? After Y = f(x), teams ask: Which process variable changed? Which input went out of control? Which root cause is driving this result? This shift reduces blame, improves clarity, and creates predictable performance. Common Pitfalls (Why Teams Struggle to Apply Y = f(x)) Jumping to solutions without validating causes Treating all causes as equal (not prioritizing critical X’s) Collecting data without clear definitions Failing to control X’s after improvement Treating Y = f(x) as a slogan, not a method Avoiding these pitfalls is what separates short-term wins from sustained improvement. Final Takeaway: Control the Cause, and the Result Takes Care of Itself If the same problems keep returning, the issue isn’t effort—it’s focus. When teams focus on the result, problems resurface. When teams control the right causes, results stabilize naturally.

Explore More

Data Types in Six Sigma: How Choosing the Right Data Transforms Your Improvement Results

Why Many Six Sigma Projects Fail Before They Begin Most Six Sigma projects don’t fail because teams lack enthusiasm. They fail quietly, early, and invisibly—because the wrong data is collected, measured incorrectly, or analysed using the wrong method. Imagine spending weeks collecting data, only to realise later that: The data cannot be analysed statistically The charts chosen don’t fit the data type The conclusions are challenged by stakeholders The improvement actions are based on weak evidence This is not a tools problem. This is a data literacy problem. In Six Sigma, data is not just input. It is the foundation on which your Define, Measure, Analyze, Improve, and Control phases stand. If that foundation is weak, everything built on top of it becomes unstable. Understanding data types is what separates professional problem-solving from guesswork. When teams clearly know what kind of data they are working with, they choose the right charts, the right tests, and the right improvement actions—with confidence. What Do We Really Mean by “Data” in Six Sigma? In everyday work, we often say “I have data” when what we really have are scattered numbers, partial records, or subjective observations. In Six Sigma, data has a stricter meaning. Data is structured information collected using defined rules to describe how a process behaves. For example: The number of defective parts produced per shift The time taken to resolve a customer ticket The temperature of a machine at different intervals Customer satisfaction ratings after a service interaction Each of these represents a different type of data, and each requires a different method of analysis. Treating them all the same is one of the fastest ways to reach the wrong conclusion. This is why the first question a Six Sigma professional asks is not: “How much data do we have?” But: “What type of data are we dealing with?” Quantitative and Qualitative Data: Two Very Different Worlds At the highest level, Six Sigma data falls into two broad categories: quantitative and qualitative. The difference is more than academic—it determines what analysis is valid. Quantitative data is numerical. It represents measurable quantities such as time, weight, cost, length, or counts. When you measure cycle time in minutes, defect rate in percentages, or downtime in hours, you are working with quantitative data. This type of data allows deeper statistical analysis. You can calculate averages, variation, trends, correlations, and relationships. Most Six Sigma tools—histograms, control charts, regression—depend on quantitative data. Qualitative data, on the other hand, describes categories, attributes, or qualities. It answers questions like: What type of defect is this? Which department handled this request? Is the customer satisfied or not? Qualitative data is extremely valuable for understanding patterns, segmentation, and root cause themes, but it cannot be analysed using the same statistical methods as numerical data. Treating qualitative data like quantitative data—for example, averaging satisfaction categories—creates misleading insights. Strong Six Sigma projects use both. Qualitative data often helps frame the problem. Quantitative data helps prove the solution. Discrete and Continuous Data: Not All Numbers Behave the Same Even within quantitative data, not all numbers are equal. Some numbers are counted. Others are measured. This distinction affects everything from chart selection to hypothesis testing. Discrete data comes from counting. It represents whole numbers and cannot be subdivided meaningfully. You can count the number of defects, the number of calls received, or the number of errors in a report. You cannot have 2.6 defects in a unit—it is either defective or not. Continuous data comes from measurement. It can take any value within a range. Time taken to process an application can be 3.2 minutes, 3.27 minutes, or 3.271 minutes depending on measurement precision. Temperature, length, speed, and weight are all continuous. Why does this matter? Because Six Sigma tools assume certain data behaviours. Control charts for counts differ from control charts for measurements. A histogram of time behaves differently from a histogram of defect counts. Mixing these up leads to incorrect conclusions about stability and performance. Professionals who master this distinction can immediately spot when a team is using the wrong analysis method. Understanding Measurement Scales: Nominal, Ordinal, Interval, and Ratio Beyond data type, Six Sigma professionals also care about measurement scales. This determines what kind of mathematical operations and comparisons are valid. Nominal data is purely categorical. There is no inherent order. For example, product categories, defect types, or machine IDs. You can count frequency, but you cannot rank or average them. Ordinal data has a meaningful order but unequal spacing. Customer satisfaction ratings such as “Poor, Average, Good, Excellent” fall into this category. While “Excellent” is better than “Good,” the distance between these categories is not mathematically equal. This means that calculating averages can be misleading. Interval data has equal spacing between values, but no true zero. Temperature in Celsius is a classic example. The difference between 20°C and 30°C is the same as between 30°C and 40°C, but 0°C does not mean “no temperature.” This affects ratio-based interpretations. Ratio data has equal spacing and a true zero. Time, weight, cost, and distance fall here. This is the most powerful scale in Six Sigma because all statistical operations are valid. Understanding these scales prevents one of the most common analytical mistakes: performing mathematically valid calculations on data that does not support them conceptually. Why Data Type Directly Determines the Tool You Should Use In Six Sigma, tools are not chosen based on preference—they are chosen based on data type. When you use a histogram, you assume continuous data. When you use a p-chart, you assume binary outcomes. When you use regression, you assume numerical relationships. When you use a Pareto chart, you assume categorical frequency. When teams mismatch tools and data, they still get charts—but the charts tell the wrong story. Leaders may approve changes based on misleading analysis, and months later, the process slips back into old behaviour. Professionals who understand data types don’t just “use tools.” They choose tools strategically, ensuring every insight is defensible in front of stakeholders, auditors, and leadership. Real-World Example: How Wrong Data Types

Explore More

DMAIC vs. DFSS: A Strategic Approach to Sustainable Quality and Business Performance

Why Six Sigma Is Not a Quick Fix (and Why Methodology Choice Matters) In many organizations, improvement initiatives begin with urgency: missed SLAs, customer complaints, quality issues, rising costs, or delivery delays. The instinct is to “fix fast.” But Six Sigma is not a quick-fix toolkit—it is a disciplined, data-driven way to solve complex problems and build sustainable performance. One of the biggest reasons Six Sigma programs fail to deliver business value is using the wrong methodology for the problem. Teams try to repair broken performance with ad-hoc actions, or they apply DMAIC to brand-new processes that haven’t stabilized yet. The result? Slow progress, low stakeholder confidence, and improvements that don’t sustain. Six Sigma offers two powerful, purpose-built methodologies: DMAIC– Improve existing products and processes DFSS (DMADV)– Design new products and processes right the first time Choosing the right methodology is the difference between temporary fixes and repeatable excellence. What Is Six Sigma, Really? Six Sigma is a structured problem-solving and design framework that focuses on reducing variation, preventing defects, and delivering customer value using data and statistical thinking. Organizations invest in Six Sigma not to produce reports—but to achieve outcomes: Six Sigma works when it is applied strategically, not mechanically. That strategy begins with choosing DMAIC or DFSS based on whether the problem exists in an existing process or in a new design.  DMAIC Explained: Improve What Already Exists DMAIC stands for Define, Measure, Analyze, Improve, Control. It is used to stabilize and improve existing processes or products that show inconsistent performance, high variation, or recurring defects. When to Use DMAIC Use DMAIC when: The process already exists and has historical data Performance is inconsistent or below target Root causes are unclear Rework and firefighting are frequent Customers complain about delays, errors, or reliability The Define phase anchors the project in customer value and business impact. Teams capture the Voice of the Customer (VOC), translate pain points into measurable CTQs (e.g., % on-time delivery, TAT adherence, defect rate), and formalize scope and governance. Key outputs: Clear problem statement (metric + timeframe) SMART goal statement Business case (why this matters) Scope (in-scope / out-of-scope) Project charter and approvals High-level process map (SIPOC) Measure: Build a Reliable Baseline You can’t improve what you can’t measure—accurately. In Measure, teams define operational definitions, validate the measurement system, collect baseline data, and compute current capability (e.g., sigma level). Key outputs: Operational definitions Measurement System Analysis (MSA) Data collection plan Baseline performance and capability Analyze: Find the Real Root Causes (Not Opinions) Analyze converts hypotheses into statistically validated root causes. Teams use Pareto, stratification, hypothesis testing, correlation/regression to isolate the few causes that drive most variation. Key outputs: Shortlist of statistically validated root causes Evidence linking causes to the CTQ Improve: Fix What Matters and Prove It Works Improve designs targeted solutions for validated causes, pilots changes, assesses risks using FMEA, and confirms gains with before–after comparisons. Key outputs: Solution design aligned to root causes FMEA with mitigation actions Pilot results with statistical validation Quantified benefits (tangible & intangible) Rollout plan Control: Lock In the Gains Control ensures improvements don’t fade. Teams institutionalize changes through SOPs, training, SPC/control charts, and response plans. Key outputs: Control plan Updated SOPs/work instructions SPC charts and monitoring cadence Handover to process owner DFSS (DMADV) Explained: Design It Right the First Time DFSS—often executed as DMADV (Define, Measure, Analyze, Design, Verify)—is used when you are creating new products, services, or processes, or when existing designs fundamentally cannot meet customer needs. When to Use DFSS (DMADV) Use DMADV when: Launching a new product or service Designing a new digital workflow or platform Building a new operating model The current design cannot meet customer requirements Rework costs are high and prevention is cheaper Define: Translate Customer Needs into Design Objectives Define clarifies the design gap and aligns objectives with customer requirements and strategy. Key outputs: VOC translated into CTQs Design objectives aligned to strategy High-level design scope and success criteria Measure: Identify Critical Characteristics and Risks Measure identifies the characteristics that must be designed to meet CTQs, assesses baseline capability (if any reference exists), and identifies design risks early. Key outputs: Critical-to-quality characteristics Risk register for design Measurement approach for verification Analyze: Compare Alternative Designs Analyze explores multiple design concepts and evaluates trade-offs (cost, risk, feasibility, performance). The goal is to choose the best design, not the most familiar one. Key outputs: Design alternatives Pros/cons and risk assessment Selected concept with rationale Design: Build the Best Solution Design converts the chosen concept into detailed process/product designs, standards, and specifications. Key outputs: Detailed design Process flows, SOP drafts Built-in quality and error-proofing Verify: Pilot, Validate, and Launch Verify pilots the design, validates performance against CTQs, documents standards, and transitions ownership to operations. Key outputs: Pilot results vs CTQs Verification plan and evidence Final SOPs and training Handover to process owner DMAIC vs DFSS (DMADV): Clear Comparison Real-World Use Cases (Across Industries) Common Mistakes to Avoid Using DMAIC for brand-new processes (no stable baseline) Jumping to solutions before root cause validation Treating DFSS as documentation-heavy design Ignoring pilot validation Skipping control plans and sustainability Final Takeaway: Choose the Methodology That Matches the Problem Fix what exists → DMAIC Build what’s new → DFSS (DMADV) When organizations match the methodology to the problem context, Six Sigma becomes a repeatable engine for business performance—not a one-time initiative.

Explore More

Toyota 3M Model Explained: How Eliminating Muda, Mura, and Muri Drives Lean Excellence

Why Lean Fails Without Addressing the 3Ms Many organizations start Lean initiatives with good intentions—cut waste, improve flow, reduce cost. Yet results stall because teams focus on visible waste (Muda) and ignore two equally damaging forces: Mura (unevenness) and Muri (overburden). Toyota’s 3M Model—Muda, Mura, Muri—is a simple but powerful lens to diagnose why processes underperform and how to fix them systemically. The Toyota 3M Model: A Quick Overview The 3M Model originates from the Toyota Production System and highlights three root conditions that degrade performance: Muda (Waste):Non–value-adding work Mura (Unevenness):Variability and inconsistency in demand or workload Muri (Overburden):Pushing people or machines beyond reasonable limits Lean excellence requires eliminating all three—not just visible waste. Muda: The 8 Wastes That Drain Value Muda includes the classic 8 wastes: Defects, Overproduction, Waiting, Non-utilized talent, Transportation, Inventory, Motion, Extra-processing. Eliminating Muda improves speed and cost—but without stabilizing flow (Mura) and capacity (Muri), waste returns. How to spot Muda: Long queues and waiting Rework loops Excess inventory Unnecessary approvals Tools to reduce Muda: Value Stream Mapping (VSM), 5S, Kaizen, Standard Work. Mura: The Hidden Enemy of Flow (Unevenness) Mura is variability—peaks and troughs in demand, staffing, or workload. Mura creates firefighting, missed SLAs, and stress. It also creates Muri (overburden) and creates Muda (waste). Examples: Month-end spikes in orders Uneven ticket volumes by shift Batch releases causing queue build-ups How to reduce Mura: Heijunka (level loading), demand smoothing, smaller batch sizes, better forecasting. Muri: Overburden That Breaks Systems and People Muri happens when capacity is ignored: unrealistic targets, chronic overtime, machines run beyond limits. Overburden causes burnout, breakdowns, quality escapes—and more Muda. Examples: Chronic overtime Overloaded machines Too many tasks for one role How to reduce Muri: Capacity planning, takt time alignment, WIP limits, cross-training. Image suggestion: Overburdened worker/machine vs balanced workload. Alt text: Reducing overburden (Muri) with capacity alignment. The Truck Loading Analogy (Simple Way to Understand 3M) Toyota often explains 3M using a truck capacity example: Muri:Overloading one truck beyond capacity Mura:Uneven loading across trucks Muda:Using too many trucks under capacity Ideal:Two trucks loaded to capacity—no waste, no unevenness, no overburden 3M in Action Across Industries Manufacturing: Muda: Rework, excess inventory Mura: Batch spikes Muri: Overloaded lines IT & ITES: Muda: Ticket rework Mura: Peak-hour spikes Muri: Night-shift overload Healthcare: Muda: Waiting times Mura: OPD rush hours Muri: Staff burnout Final Takeaway: Eliminate All Three to Achieve Flow Lean excellence is not about removing visible waste alone. Sustainable performance comes from eliminating Muda (waste), Mura (unevenness), and Muri (overburden) together—creating smooth flow, predictable delivery, and healthier work systems.    

Explore More

Histogram in Six Sigma: A Practical Guide to Understanding Process Behavior and Data Distribution – Part 2

Understanding the Shape of Your Data Histograms help identify the shape of the distribution, which directly informs how you analyze and improve a process: 1) Normal Distribution (Bell Curve) Symmetric around the mean Most values cluster in the middle Many statistical tools assume normality 2) Skewed Distribution Right-skewed: long tail to the right (e.g., response times with a few very long delays) Left-skewed: long tail to the left 3) Bimodal or Multimodal Two or more peaks Often indicates multiple process streams or conditions Example: two different teams handling tickets differently Real-World Example: IT Support Ticket Response Time Consider an IT support system tracking time to first response for tickets. A histogram shows: Highest frequency in the 2–3 hour range A longer tail to the right(some tickets take much longer) A second smaller peak at 13–14 hours If you only looked at the mean and standard deviation, you might miss that there are two peaks, indicating two different behaviors—perhaps: Tickets handled by different shifts Complex tickets routed to a specialized queue System downtime during certain hours Histograms surface these insights immediately and guide root cause analysis. How to Create a Histogram (Step-by-Step) Collect continuous data Ensure consistent measurement definitions. Choose bin width Too few bins hide patterns; too many create noise. Plot frequencies Count how many observations fall in each bin. Review the shape Look for center, spread, skewness, and peaks. Overlay targets or specs (optional) Helps compare performance vs expectations.  Common Mistakes When Using Histograms Using histograms for categoricaldata Choosing inappropriate bin sizes Interpreting a single histogram without context Ignoring multi-modal patterns Treating histogram results as final answers (they are diagnostic, not conclusive How ICEQBS Teaches Histograms (Beyond Theory) Many programs explain histograms in isolation. ICEQBS focuses on application in real projects: Learners build histograms using their own workplace data Trainers help interpret shapes and link them to process causes Histograms are used alongside Pareto, Fishbone, and hypothesis testing Teams learn to move from “pretty charts” to actionable insights This practical approach ensures professionals don’t just draw histograms—they use them to improve performance. Final Takeaway: If You Can See Your Data, You Can Improve Your Process Histograms turn raw numbers into clear stories about how a process behaves. They reveal patterns, variation, and hidden problems that averages alone cannot show. In Six Sigma, histograms are often the first step from opinion to evidence—and from evidence to improvement. If your team is serious about data-driven excellence, mastering histograms is not optional—it’s foundational.

Explore More

Histogram in Six Sigma: A Practical Guide to Understanding Process Behavior and Data Distribution – Part 1

In process improvement, the most dangerous phrase is: “The average looks fine.” Averages hide problems. Two processes can have the same mean and standard deviation, yet behave completely differently. This is why quality professionals rely on visual tools—and among the 7 QC tools, the Histogram is one of the most powerful for making data behavior visible. A histogram does not just summarize numbers; it reveals the shape of reality. It helps teams quickly see: Where most values cluster (approximate mean) How wide the variation is (dispersion) Whether the data is symmetric or skewed Whether there are outliers Whether the process has one peak (unimodal) or multiple peaks (bimodal/multimodal) In Lean Six Sigma projects—especially in Measure and Analyze phases—histograms provide the first honest look at how a process is performing. What Is a Histogram (in Simple Terms)? A histogram is a bar chart that shows how frequently data points fall within defined ranges (called bins or classes). Each bar represents a range of values, and the height of the bar shows how many observations fall into that range. Unlike a simple bar chart of categories, a histogram is used for continuous data such as: Height Weight Diameter Time Cost Cycle time Response time It is particularly useful to understand: Approximate location of the mean Spread/variation in data Skewness (left or right) Presence of outliers Distribution type (normal, bimodal, multimodal)   Why Histograms Matter in Lean Six Sigma In Lean Six Sigma, decisions must be data-driven. Histograms help teams move from assumptions to evidence. They are commonly used in: Measure phase: to understand baseline performance Analyze phase: to explore patterns and variation Control phase: to monitor stability over time (in combination with control charts) Histograms answer critical questions: Is the process centered around the target? Is variation too wide? Are there hidden sub-populations? Are there extreme values (outliers) that need investigation? By visually displaying distribution, histograms reveal patterns that numeric summaries alone can hide.

Explore More

How to Become a Certified Six Sigma Green Belt – Your Complete Career Guide with ICEQBS

How to Become a Certified Six Sigma Green Belt – Your Complete Career Guide with ICEQBS Introduction In today’s rapidly evolving business landscape, organizations are under constant pressure to improve operational efficiency, reduce costs, enhance product quality, and deliver exceptional customer experiences. To achieve these goals, companies across industries are adopting Lean Six Sigma methodologies and seeking professionals with proven process improvement skills. One of the most respected credentials in this field is the Six Sigma Green Belt Certification. It equips professionals with the knowledge and practical tools needed to analyze processes, identify inefficiencies, eliminate waste, reduce defects, and drive continuous improvement initiatives. Whether you are an engineer, quality professional, project manager, business analyst, healthcare specialist, or recent graduate, becoming a certified Six Sigma Green Belt can significantly enhance your career opportunities. ICEQBS offers comprehensive Lean Six Sigma Green Belt training through live online classes, expert-led instruction, practical case studies, Minitab training, and real-world projects. The training is designed to help professionals gain industry-relevant skills and confidently pursue certification while applying Lean Six Sigma concepts in their workplaces. Why Six Sigma Green Belt Certification Matters Businesses today rely on data-driven decision-making to improve quality and operational performance. Six Sigma Green Belt professionals play an important role in identifying process inefficiencies and implementing measurable improvements. A certified Green Belt can: Improve business processes Reduce operational costs Minimize defects Increase productivity Improve customer satisfaction Support organizational growth Lead improvement initiatives Contribute to continuous improvement culture These capabilities make Green Belt certification valuable across almost every industry. What Does a Six Sigma Green Belt Professional Do? A Green Belt professional is responsible for improving processes using the DMAIC methodology while collaborating with cross-functional teams. Typical responsibilities include: Identifying business problems Collecting and analyzing process data Measuring process performance Identifying root causes Implementing improvement solutions Monitoring process stability Supporting Lean initiatives Reducing waste and variation Reporting measurable business improvements Green Belt professionals often work under the guidance of Black Belts while independently managing smaller improvement projects. Your Roadmap to Becoming a Certified Six Sigma Green Belt 1. Learn the Fundamentals of Lean Six Sigma The first step is understanding the core concepts behind Lean and Six Sigma. Topics include: Lean Principles Six Sigma Concepts Customer Focus Process Variation Waste Reduction Continuous Improvement Quality Management Data-Based Decision Making These fundamentals provide the foundation for advanced learning. 2. Choose Professional Training The quality of your training significantly impacts your learning experience and certification success. A professional Six Sigma course should include: Live instructor-led sessions Comprehensive curriculum Interactive learning Practical assignments Industry case studies Project guidance Minitab software training Mock examinations Certification preparation ICEQBS delivers structured training programs led by experienced trainers who emphasize practical application alongside theoretical knowledge. 3. Understand the DMAIC Framework DMAIC is the heart of Six Sigma methodology and serves as the roadmap for solving process-related problems. Define Clearly identify the business problem, customer requirements, project scope, and objectives. Measure Collect relevant data to establish the current performance of the process. Analyze Use statistical and analytical tools to identify the root causes of process issues. Improve Develop and implement effective solutions to eliminate root causes and improve performance. Control Create monitoring systems to ensure improvements are sustained over time. Mastering DMAIC is essential for earning Green Belt certification and succeeding in real-world projects. Learn Essential Six Sigma Tools A Green Belt professional should be comfortable using various quality and statistical tools, including: SIPOC Diagram Process Mapping Pareto Charts Fishbone Diagram Control Charts Histograms Scatter Diagrams Cause-and-Effect Analysis Process Capability Analysis Failure Mode and Effects Analysis (FMEA) Root Cause Analysis Statistical Process Control (SPC) These tools help professionals make informed decisions based on accurate data. Gain Hands-On Experience with Minitab Statistical software plays a key role in Six Sigma projects. Minitab enables professionals to: Analyze complex datasets Generate graphs and charts Perform hypothesis testing Measure process capability Monitor process stability Validate improvement results ICEQBS incorporates practical Minitab training into its Green Belt program, enabling participants to confidently apply statistical techniques in real business scenarios. Participate in Real-Time Projects Practical experience is one of the most valuable aspects of Green Belt training. Project work allows learners to: Apply DMAIC methodology Solve actual business challenges Improve analytical thinking Develop problem-solving skills Gain confidence in using Six Sigma tools Demonstrate measurable improvements Real-world project exposure enhances both learning outcomes and employability. Prepare Effectively for Certification Successful candidates typically follow a structured preparation plan. Preparation should include: Reviewing course materials Practicing statistical concepts Completing mock tests Revising DMAIC phases Solving case-study questions Understanding quality management principles Practicing Minitab exercises Regular revision improves confidence and exam performance. Pass the Certification Examination After completing your training and preparation, the next step is to successfully pass the certification examination. The exam assesses your ability to: Apply Lean Six Sigma principles Use quality improvement tools Analyze business data Solve process problems Interpret statistical results Manage improvement projects Certification demonstrates your competence in applying Lean Six Sigma methodologies effectively. Skills You Develop Through Green Belt Certification Completing Green Belt training helps professionals develop valuable skills such as: Process Improvement Data Analysis Statistical Thinking Leadership Problem Solving Risk Management Team Collaboration Project Coordination Decision Making Quality Management Customer Focus Continuous Improvement These skills remain valuable across industries and career levels. Industries That Value Six Sigma Green Belt Professionals Green Belt certification is recognized across numerous sectors, including: Manufacturing Information Technology Healthcare Banking and Financial Services Pharmaceuticals Logistics and Supply Chain Automotive Aerospace Telecommunications Retail Construction Energy Education Hospitality Organizations in these industries use Lean Six Sigma to improve quality, reduce costs, and increase customer satisfaction. Career Opportunities After Certification A Six Sigma Green Belt certification can open doors to roles such as: Quality Engineer Process Improvement Specialist Business Analyst Operations Executive Continuous Improvement Coordinator Manufacturing Engineer Project Coordinator Quality Analyst Supply Chain Analyst Operations Manager Production Supervisor Lean Six Sigma Consultant Professionals with Green Belt certification are often considered for leadership roles involving quality improvement and operational excellence. Why Choose ICEQBS for Six

Explore More

How to Get Six Sigma Green Belt Certified Guide by ICEQBS

How to Get Six Sigma Green Belt Certified – A Complete Step-by-Step Guide by ICEQBS Introduction In today’s competitive business environment, organizations are constantly searching for professionals who can improve processes, reduce costs, eliminate defects, and enhance customer satisfaction. As industries increasingly adopt continuous improvement methodologies, Six Sigma Green Belt certification has become one of the most valuable credentials for professionals seeking career advancement. Whether you work in manufacturing, IT, healthcare, banking, logistics, automotive, construction, pharmaceuticals, telecommunications, retail, or service industries, earning a Six Sigma Green Belt certification demonstrates your ability to solve business problems using proven data-driven techniques. At ICEQBS, professionals receive industry-focused Lean Six Sigma training through live online classes, practical case studies, DMAIC projects, Minitab training, and expert mentoring from an experienced Master Black Belt trainer. ICEQBS offers globally recognized Lean Six Sigma Green Belt and Black Belt programs designed to prepare professionals for real-world process improvement challenges. What is Six Sigma Green Belt Certification? A Six Sigma Green Belt certification validates that you understand the Lean Six Sigma methodology and can successfully participate in or lead process improvement projects within an organization. Green Belt professionals learn how to: Identify process inefficiencies Reduce process variation Eliminate waste Improve quality Increase productivity Analyze business data Solve operational problems Improve customer satisfaction The certification focuses heavily on the DMAIC methodology, which stands for: Define Measure Analyze Improve Control DMAIC provides a structured framework for solving business problems using data instead of assumptions. Who Should Get Six Sigma Green Belt Certified? The Green Belt certification is suitable for professionals from almost every industry, including: Quality Engineers Production Engineers Manufacturing Professionals Project Managers Operations Managers Process Engineers Supply Chain Professionals Healthcare Professionals IT Professionals Business Analysts Consultants Team Leaders Continuous Improvement Professionals Fresh Graduates looking for career opportunities One of the biggest advantages of Green Belt certification is that it is useful regardless of your industry. Step-by-Step Process to Get Six Sigma Green Belt Certified Step 1: Understand Six Sigma Fundamentals Before enrolling in any certification program, understand the basic concepts of Six Sigma. These include: Process Improvement Customer Focus Quality Management Variation Reduction Waste Elimination Data-Driven Decision Making Statistical Thinking Continuous Improvement Having a strong foundation makes learning advanced topics much easier. Step 2: Choose a Trusted Training Institute Selecting the right training provider is one of the most important decisions in your certification journey. A high-quality training institute should provide: Live instructor-led training Experienced Master Black Belt trainers Practical examples Real-world case studies Project guidance Minitab software training Practice examinations Flexible online learning Lifetime learning support ICEQBS provides comprehensive Lean Six Sigma Green Belt training aligned with globally recognized standards, combining practical instruction with hands-on learning and experienced faculty. Step 3: Enroll in a Structured Green Belt Program A structured course helps you learn concepts in the correct sequence. A complete Green Belt curriculum generally includes: Lean Fundamentals Lean Principles 7 Wastes Value Stream Mapping Process Flow Six Sigma Fundamentals Voice of Customer Critical to Quality (CTQ) Process Variation Sigma Levels DMAIC Methodology Define Phase Measure Phase Analyze Phase Improve Phase Control Phase Statistical Tools Descriptive Statistics Probability Hypothesis Testing Process Capability Control Charts Pareto Analysis Fishbone Diagram Regression Analysis Improvement Techniques Root Cause Analysis Failure Mode and Effects Analysis (FMEA) Risk Assessment Process Optimization Step 4: Learn Minitab Software Modern Six Sigma professionals use statistical software for data analysis. Learning Minitab allows professionals to: Analyze data Create control charts Perform capability analysis Conduct hypothesis testing Generate statistical reports Improve decision-making ICEQBS includes practical Minitab sessions as part of its Green Belt training to help learners apply statistical concepts effectively. Step 5: Work on Real Business Case Studies Reading theory alone is not enough. Practical learning helps professionals understand how Six Sigma tools solve actual business problems. Real-world projects develop skills in: Data collection Process mapping Root cause analysis Statistical analysis Improvement planning Sustaining improvements Hands-on case studies significantly improve confidence and job readiness. Step 6: Practice DMAIC Projects Most successful Green Belt professionals spend time applying DMAIC to actual workplace challenges. Example projects include: Reducing manufacturing defects Improving customer service response time Reducing inventory costs Improving software quality Increasing production efficiency Reducing process delays Improving healthcare services Optimizing supply chain operations Practical project experience makes the certification more valuable to employers. Step 7: Prepare for the Certification Examination A successful preparation strategy includes: Reviewing all DMAIC phases Practicing statistical calculations Solving sample questions Taking mock examinations Reviewing case studies Revising quality management concepts Consistent practice improves both knowledge and confidence. Step 8: Pass the Green Belt Certification Exam Once you complete your training and preparation, you can take the certification examination. A successful result demonstrates your ability to: Apply Lean Six Sigma tools Analyze business processes Improve operational performance Lead process improvement initiatives Support organizational excellence Skills You Gain After Green Belt Certification After completing your certification, you will develop expertise in: Problem Solving Process Mapping Lean Thinking Statistical Analysis Root Cause Analysis Project Management Data Interpretation Risk Analysis Team Collaboration Continuous Improvement Quality Management Business Process Optimization These skills are highly valued across industries. Benefits of Getting Six Sigma Green Belt Certified Some of the biggest career advantages include: Improved career opportunities Higher earning potential Better leadership skills Strong analytical thinking Increased problem-solving capability Greater organizational impact Enhanced productivity Improved customer satisfaction Global career recognition Better project management skills Organizations prefer certified professionals because they can deliver measurable business improvements. Why Choose ICEQBS for Six Sigma Green Belt Certification? ICEQBS has established itself as a trusted provider of Lean Six Sigma and project management training by focusing on practical, career-oriented education. Key advantages include: Live online instructor-led training Experienced Master Black Belt trainer with extensive industry experience Programs aligned with globally recognized Six Sigma bodies of knowledge Practical DMAIC projects and real-life case studies Hands-on Minitab practice Weekend batches for working professionals Flexible online learning accessible worldwide Practice tests and exam preparation support Guidance for real-world process improvement projects Globally recognized certification programs Career Opportunities After

Explore More

Subscribe to Our Newsletter

©2026, ICEQBS All Rights Reserved.